Montgomery County Kindergarten Readiness Data

The Kindergarten Readiness Assessment (KRA) is a developmentally appropriate assessment tool administered to incoming public-school kindergarteners during the first weeks of school. The KRA determines if students have the knowledge, skills, and behaviors necessary to be successful in kindergarten.
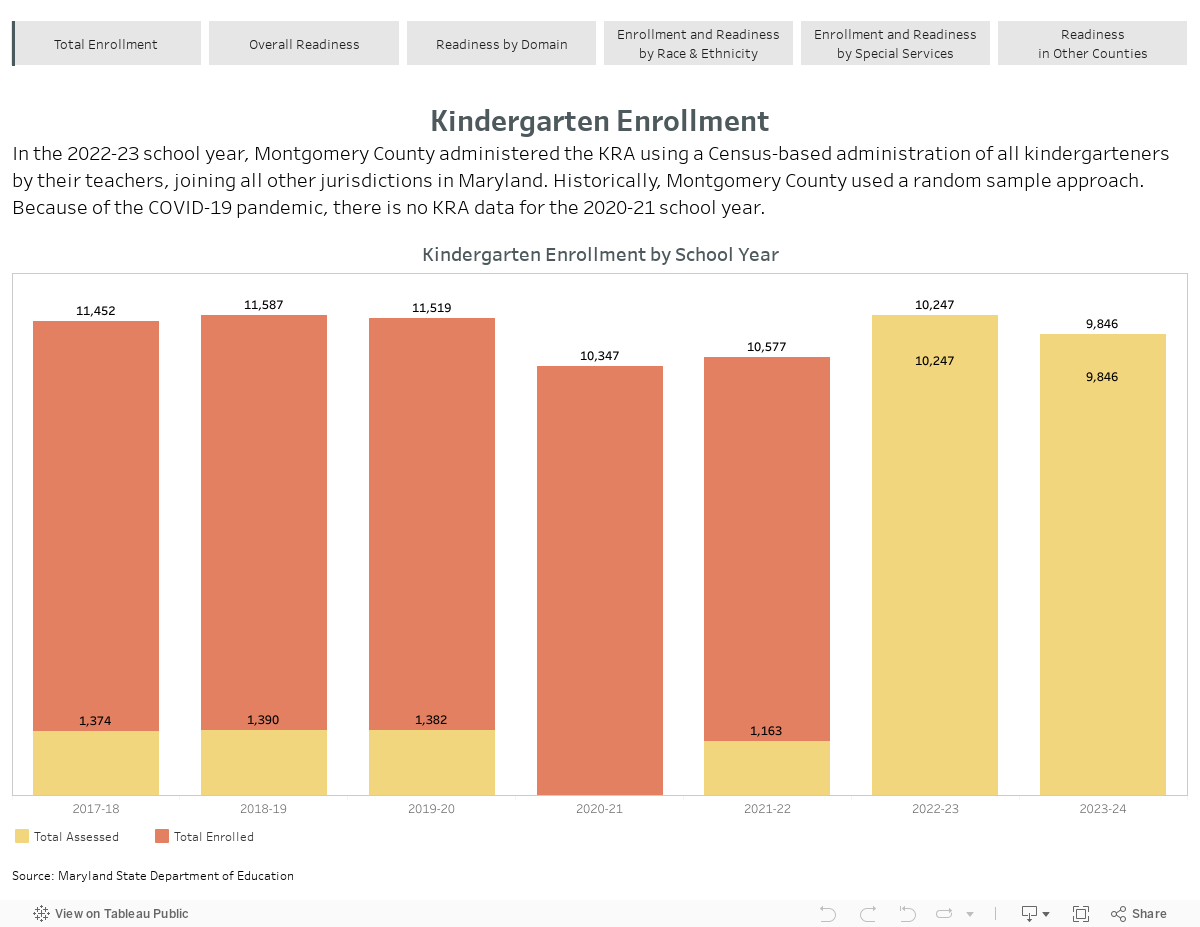
In the 2022-23 school year, Montgomery County administered the KRA using a Census-based administration of all kindergarteners by their teachers, joining all other jurisdictions in Maryland. Historically, Montgomery County used a random sample approach. Because of the COVID-19 pandemic, there is no KRA data for the 2020-21 school year.


Explore the Data

Enrollment Data

Kindergarten Enrollment by School Year


Source: Maryland State Department of Education


Kindergarten Enrollment by Race/Ethnicity 


Source: Maryland State Department of Education


Kindergarten Enrollment by Subgroup 

  • Direct Certified: Children who are Direct Certified include children receiving Supplemental Nutrition Assistance Program (SNAP) or temporary Assistance for Needy Families (TANF) or are experiencing homelessness, in foster care, or are migrants or considered runaways. Direct certification status does not represent all children who are living in poverty because not all eligible families access these services.  

  • Identified Disabilities: Children with Identified Disabilities are those with an identified disability and receive services through an Individualized Education Program (IEP). 

  • English Learners: Children who are English Learners include Multilingual students or are students who speak a language other than English at home.


Source: Maryland State Department of Education


Readiness Data

Kindergarten Readiness Assessment by Level of Readiness

A child assessed with the KRA is identified as at one of the following levels. The chart below represents the percent of all students demonstrating various levels of readiness by school year.


Source: Maryland State Department of Education


Description of Readiness Levels:

  • Demonstrating Readiness: A child demonstrates the foundational skills and behaviors that prepare them for curriculum based on the kindergarten standards. 

  • Approaching Readiness: A child exhibits some of the foundational skills and behaviors that prepare them for curriculum based on the kindergarten standards. 

  • Emerging Readiness: A child displays minimal foundational skills and behaviors that prepare them for curriculum based on the kindergarten standards. 


Kindergarten Readiness Assessment by Domain

Average score compared to total possible score (298 Social Foundation, Language & Literacy, and Mathematics; 293 for Physical Well-being) for in each domain.


Note: The scale represents the total possible score for each domain. The average score is the average value across all students in each domain.

Source: Maryland State Department of Education  


Kindergarten Readiness Assessment by Race/Ethnicity


*Fewer than 25 kindergarteners or less than 1% assessed. 

Source: Maryland State Department of Education


Kindergarten Readiness Assessment by Student Subgroup


Source: Maryland State Department of Education


Kindergarten Readiness Assessment By Jurisdiction

Readiness Across Maryland Jurisdictions in 2023 - percent of all students demonstrating readiness.

Jurisdiction 2017-18 2018-19 2019-20 2020-21 2021-22 2022-23
Maryland (State) 39% 41% 50% - 35% 41%
Allegany 48% 48% 46% - 40% 48%
Anne Arundel 41% 39% 37% - 25% 39%
Baltimore City 47% 49% 48% - 37% 49%
Baltimore County 52% 45% 51% - 38% 45%
Calvert 45% 45% 55% - 49% 45%
Caroline 59% 61% 59% - 54% 61%
Carroll 42% 32% 44% - 34% 32%
Cecil 39% 40% 44% - 37% 40%
Charles 44% 40% 44% - 29% 40%
Dorchester 54% 59% 57% - 50% 59%
Frederick 61% 55% 53% - 44% 55%
Garrett 45% 43% 45% - 41% 43%
Harford 54% 56% 57% - 54% 56%
Howard 62% 53% 54% - 53% 53%
Kent 45% 47% 47% - 40% 47%
Montgomery 47% 54% 53% - 46% 54%
Prince George's 34% 39% 35% - 28% 39%
Queen Anne's 48% 57% 48% - 41% 57%
Saint Mary's 42% 42% 45% - 39% 42%
Somerset 57% 60% 63% - 40% 60%
Talbot 45% 42% 43% - 41% 42%
Washington 37% 43% 44% - 42% 43%
Wicomico 47% 41% 43% - 33% 41%
Worcester 56% 66% 64% - 62% 66%

Want to use this publicly available data toward action for your own organization?

Download the Excel file with all of the data you see on this page.